CKB 二层网络的实时观测工具
引言
Fiber 是构建在 CKB 上的支付通道网络,支持快速、低成本的链下价值传输。虽然协议本身已稳定运行,但要了解其真实状态——比如有多少活跃节点、流动性分布在哪里、通道如何开闭——一直很困难。相关数据分散在链上交易和各个节点中,缺乏统一的观察入口。
Fiber Network Dashboard 正是为解决这个问题而生。它将链上与网络层数据聚合到一个公开界面,提供对网络结构、活动和健康状况的实时可视化,无需技术背景或运行节点即可使用。
访问地址:https://dashboard.fiber.channel
为什么需要它?
与主链不同,像 Fiber 这样的二层网络主要在链下运行。这提升了可扩展性,但也带来了可观测性的挑战:大多数活动(如通道更新、HTLC 路由、余额变动)并不直接记录在区块链上,仅通过查看链上数据无法完整还原网络的真实状态。
如果没有可观测性:
- 节点运营者难以监控自己的连接状态和通道表现
- 流动性提供者无法掌握资金分布与潜在风险
- 开发者和研究人员缺少分析网络趋势或排查问题的依据
- 社区成员无从判断网络是否在健康增长
Dashboard 通过结构化呈现真实数据,让隐性的网络活动变得显性、可验证、可操作。
面向谁?
- 节点运营者:查看自身节点状态、支持的资产、自动接受门槛及所有关联通道
- 流动性提供者:监控总流动性、通道分布,以及 CKB/USDI 的资产流向
- 开发者与研究人员:分析网络拓扑、通道生命周期、关闭行为等模式
- 社区成员:快速了解 Fiber 的活跃度、规模和实时动态
核心功能
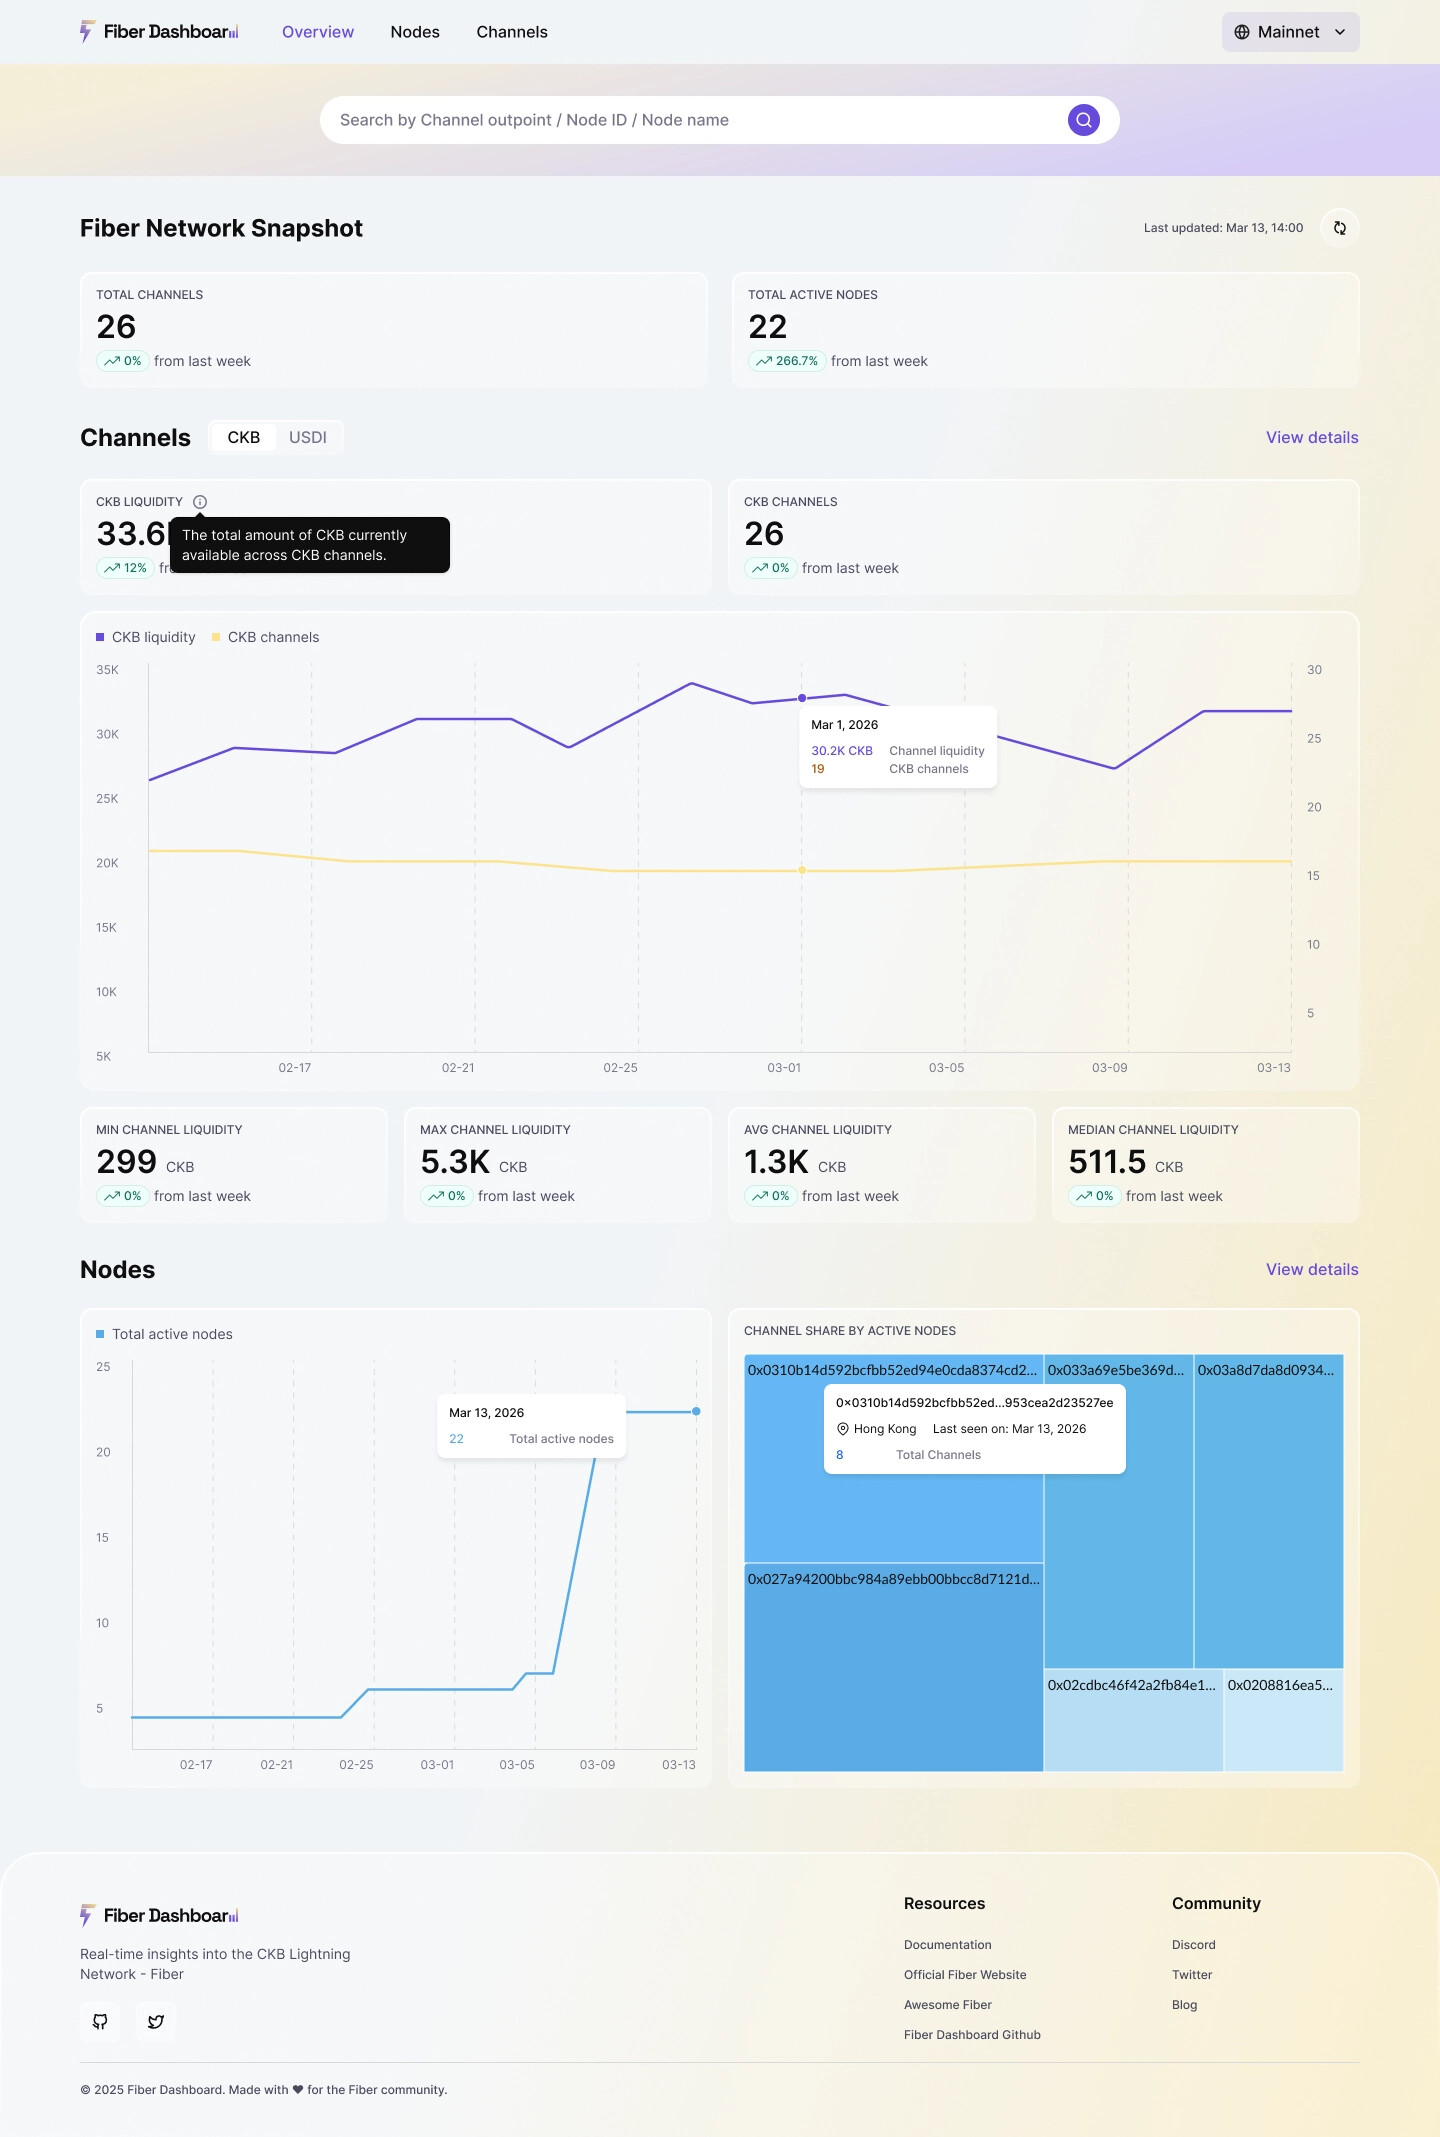
1. 网络概览(首页)
-
实时显示活跃节点数与通道总数
-
对比上周变化趋势(上升/下降)
-
支持切换 CKB / USDI 资产视图,联动刷新所有指标
-
Node 树状图视图,其中较大的区块代表拥有更多通道的节点,使高度连接的节点更易于识别。
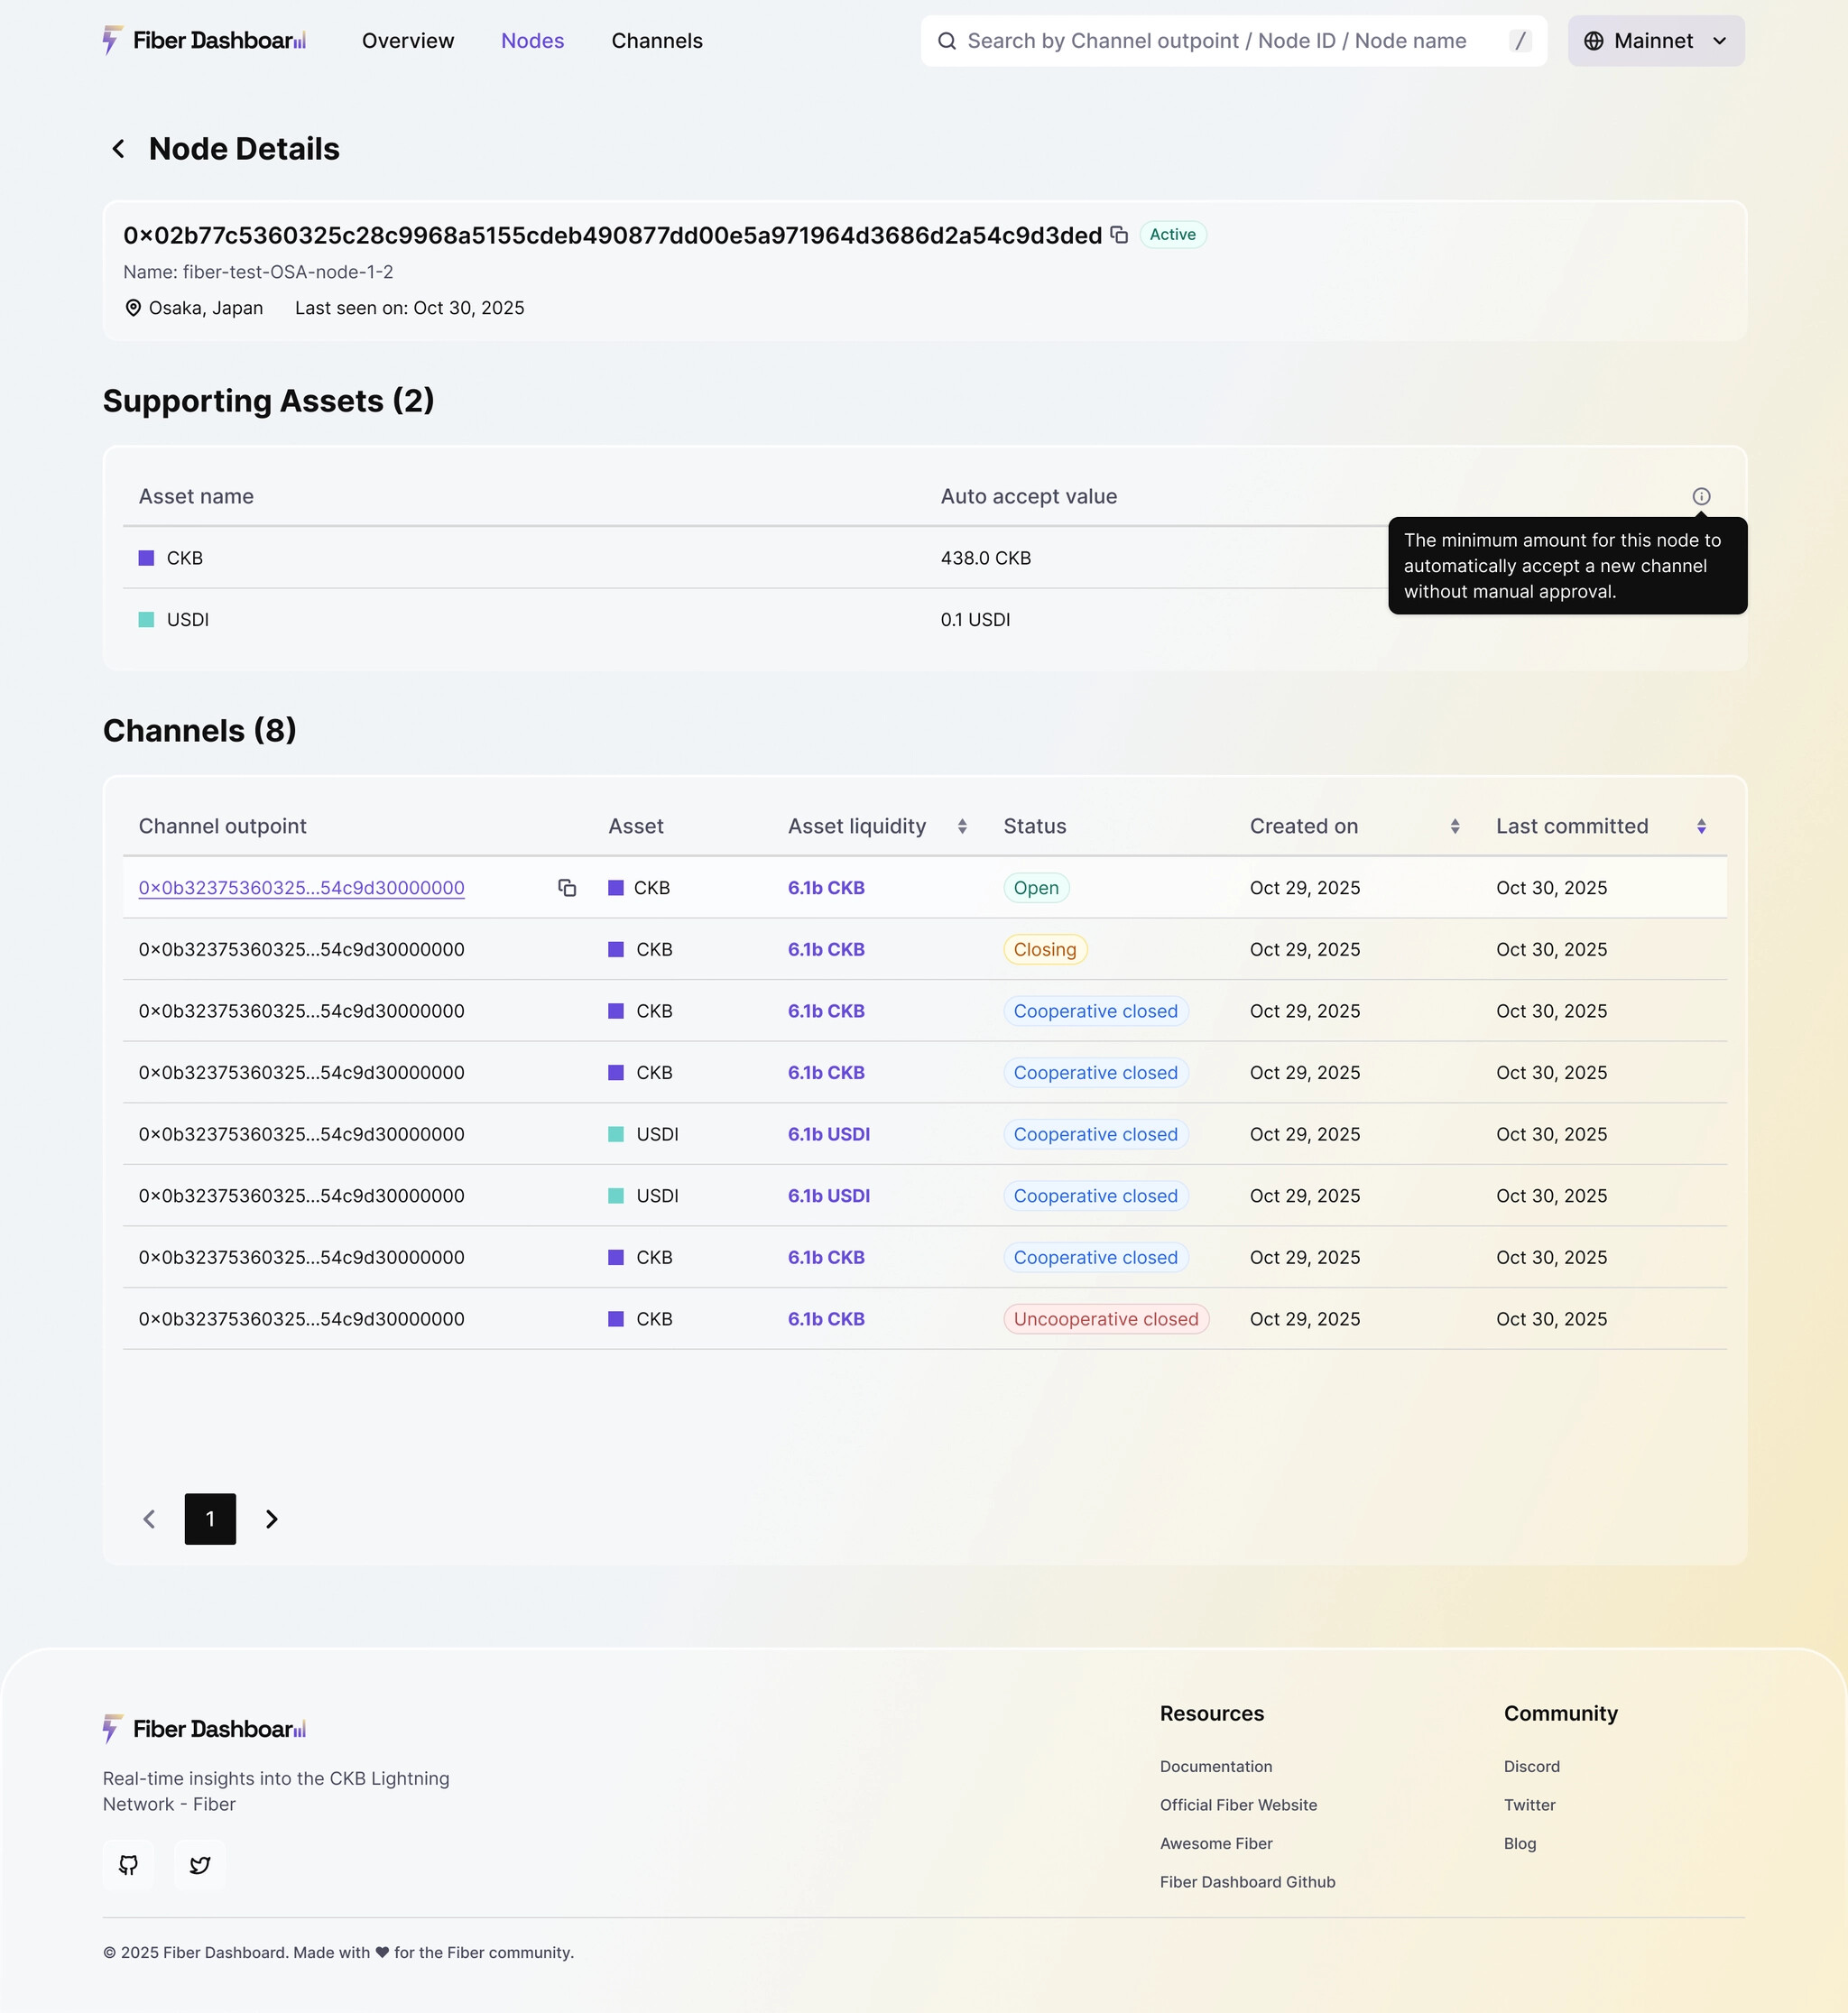
2. 节点详情
-
一张全球地图,可视化展示 Fiber 节点的地理分布及其之间的通道连接,帮助用户一目了然地理解网络结构。
-
支持按国家、节点 ID 或名称搜索(防抖 500ms),结果可按活跃度、通道数等排序
-
单个节点页面包含:
- 节点名称、ID(一键复制)、地理位置、最后活跃时间
- 支持的资产类型及 Auto Accept 最小额度(自动接受通道的最低资金门槛)
- 所有参与通道列表,支持分页与排序,点击可跳转通道详情
3. 通道洞察
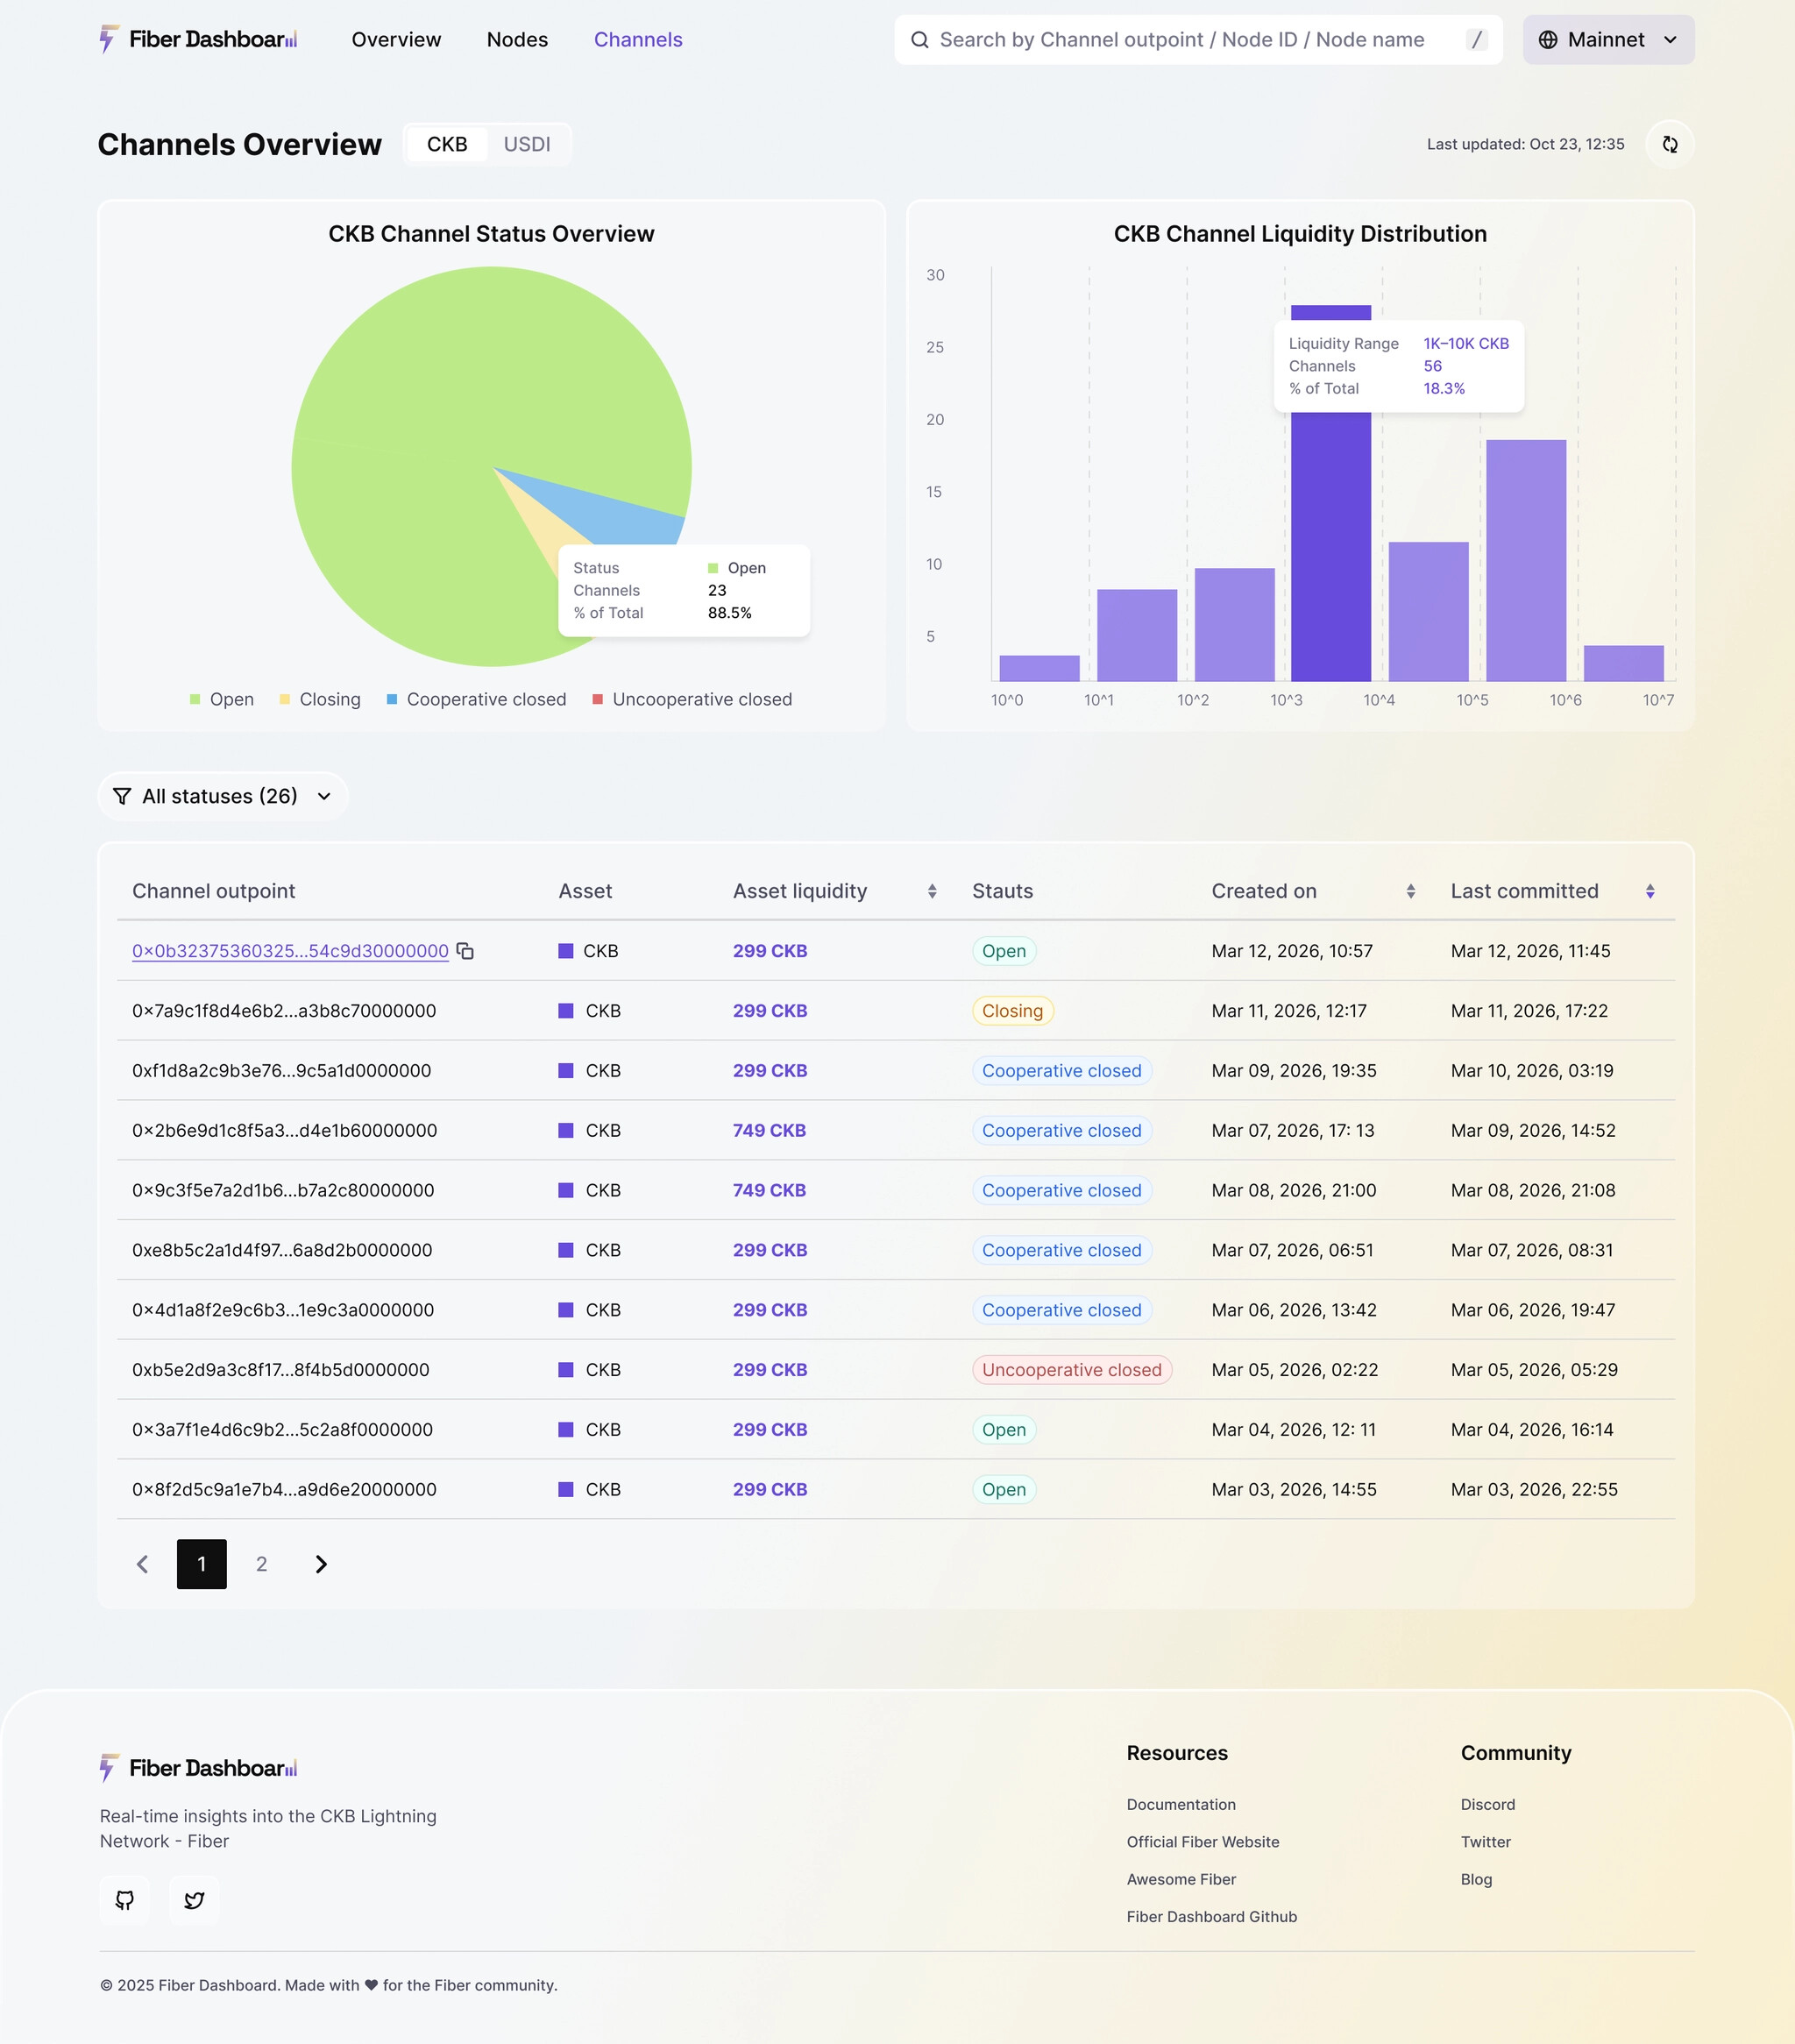
- 概览视图:
- 通道状态分布(Open / Closing / Cooperative Closed / Uncooperative Closed),反映网络健康度
- CKB 或 USDI 的流动性分布直方图(按对数刻度分组)
- 通道列表:
- 可按状态筛选(各状态旁显示实时数量)
- 支持按流动性、创建时间等排序
- 每条记录提供 Outpoint 复制按钮,便于链上验证
4. 通道生命周期详情
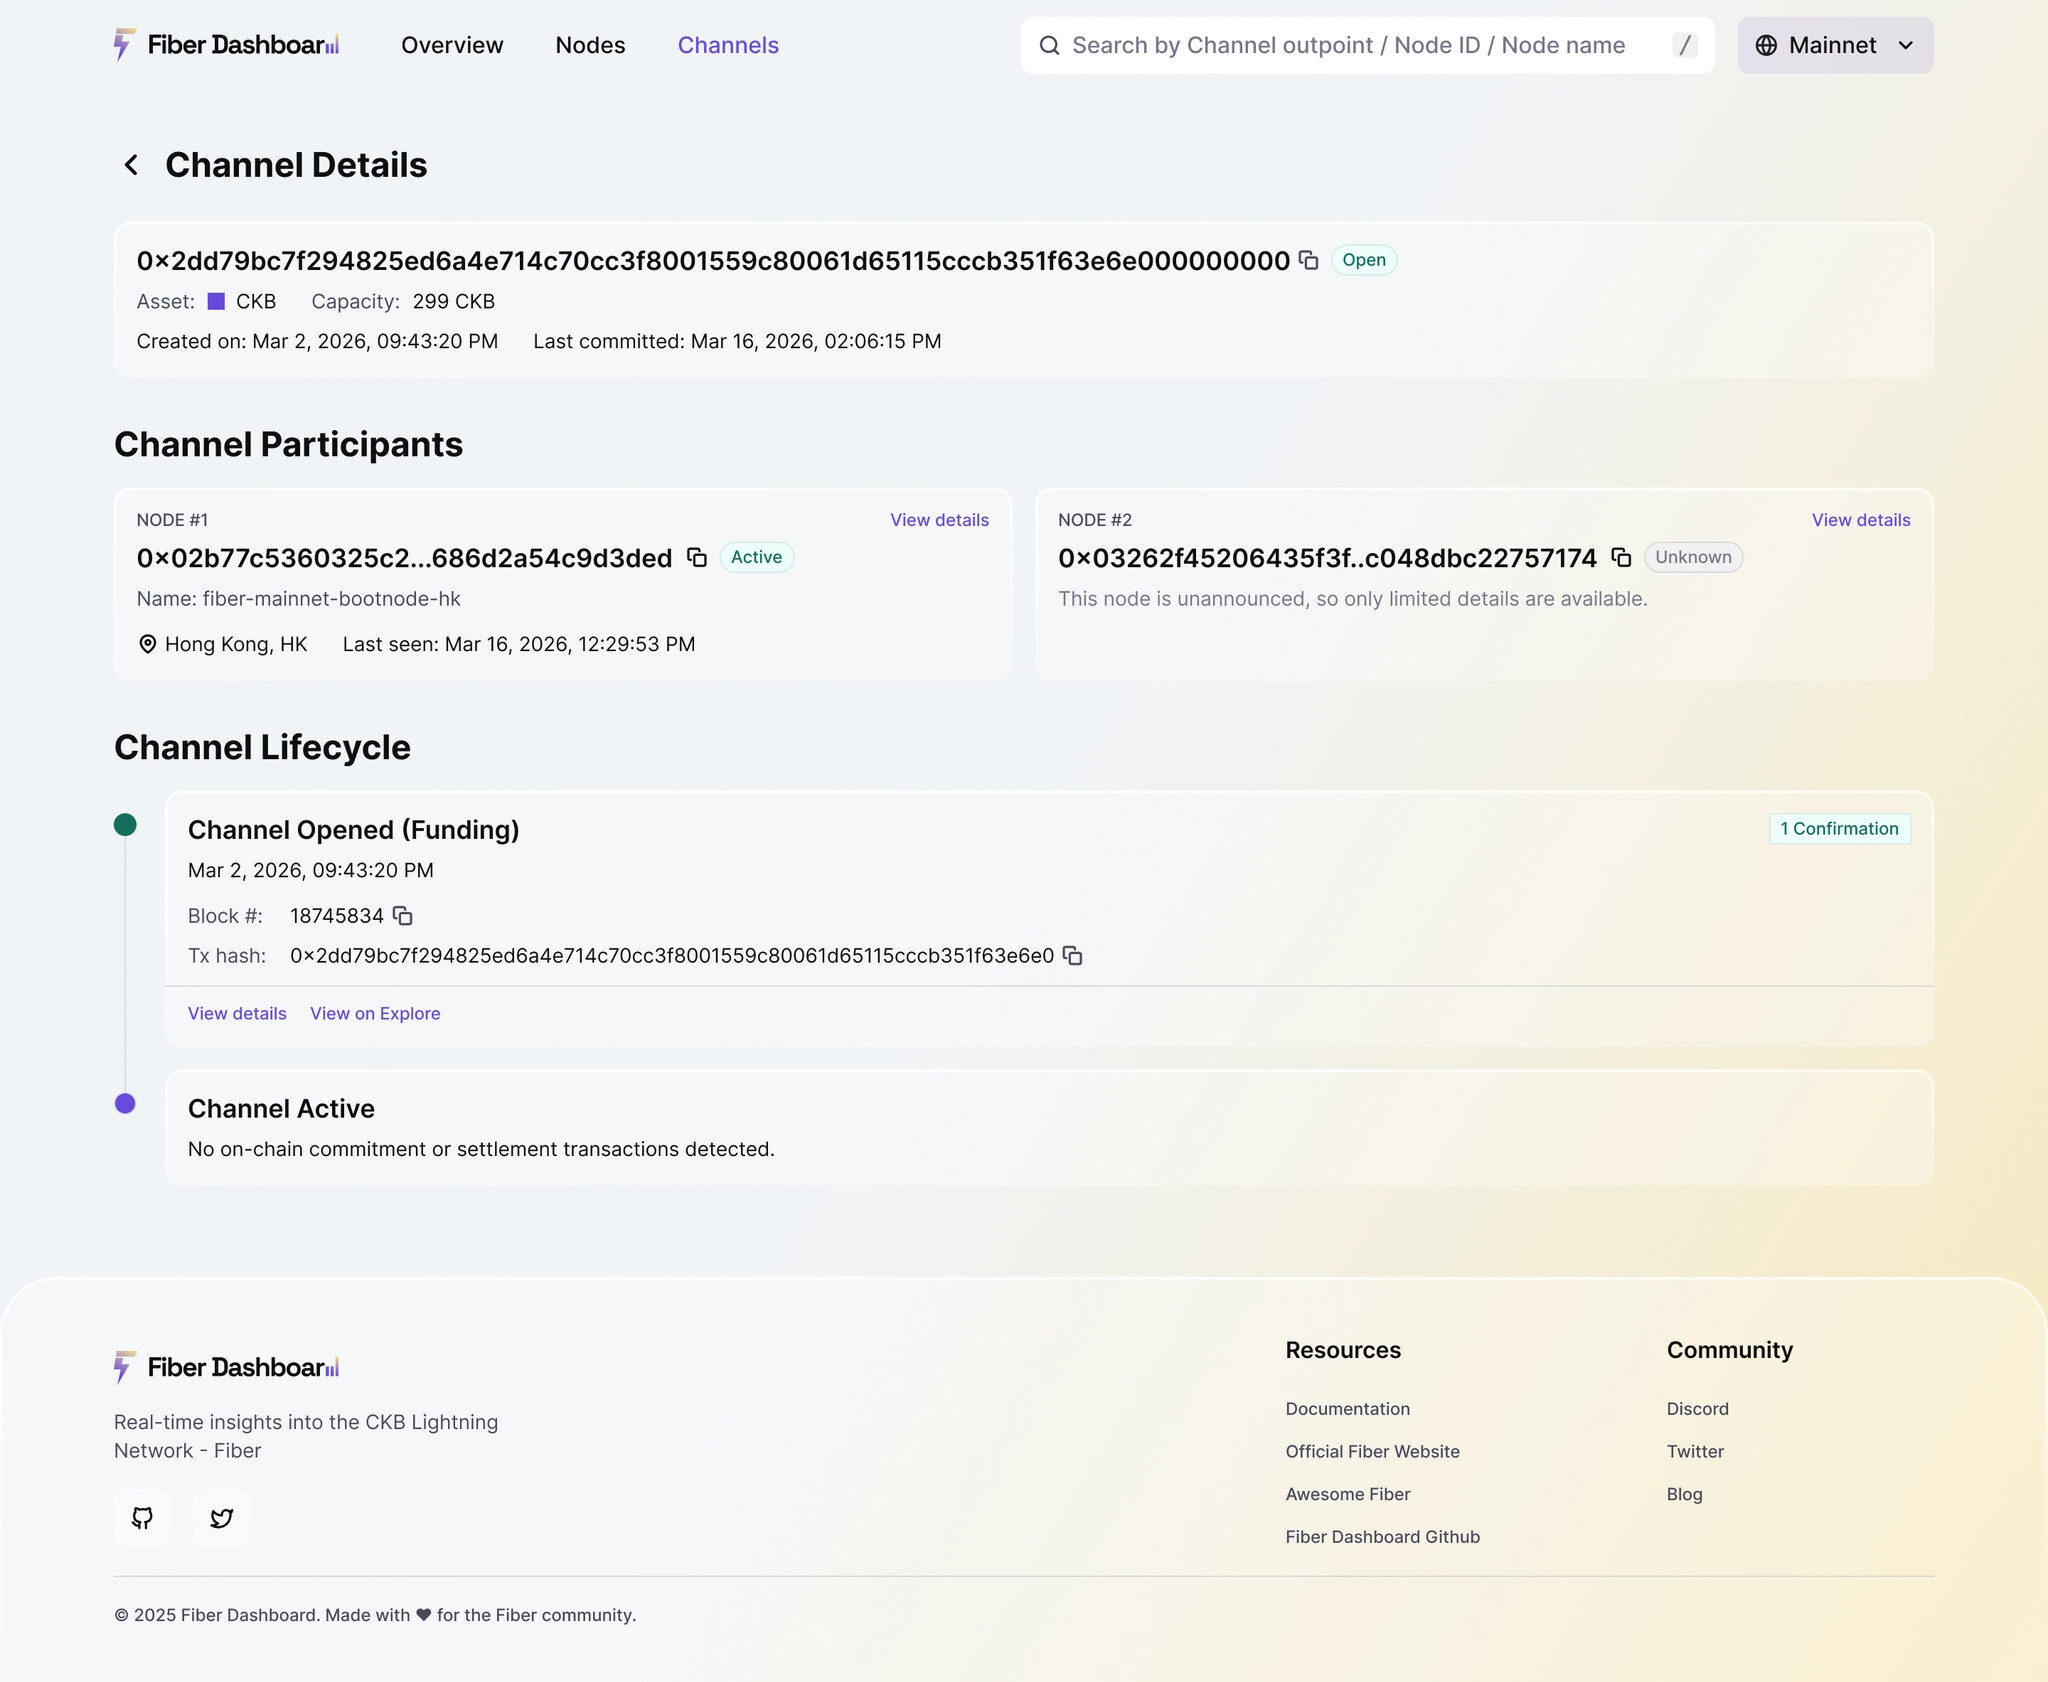
针对任意通道,完整还原其链上事件时间轴:
- 开通道(Funding):表示两个节点通过一笔 Funding 交易在链上创建了一个支付通道。页面显示区块高度、交易哈希,并提供一键跳转至 CKB Explorer 的链接,方便验证这笔资金锁定是否成功。
- Commitment 更新:代表通道内发生了一次状态变更,例如资金转移或 HTLC 建立。系统会解析并展示:
- 自动解析 Lock Args(公钥哈希、安全延迟、协议版本等)
- 展示本地/远端结算金额、Pending HTLC 列表、Unlock 详情
- 关通道(Settlement):表示通道已结束,资金根据最终状态进行链上结算。明确标注为合作关闭( 蓝色)或非合作关闭(红色),并显示关闭时间与交易详情。合作关闭是双方协商一致的结果;非合作关闭则是一方单方面强制结算,可能意味着争议或异常行为。
5. 全局搜索与网络切换
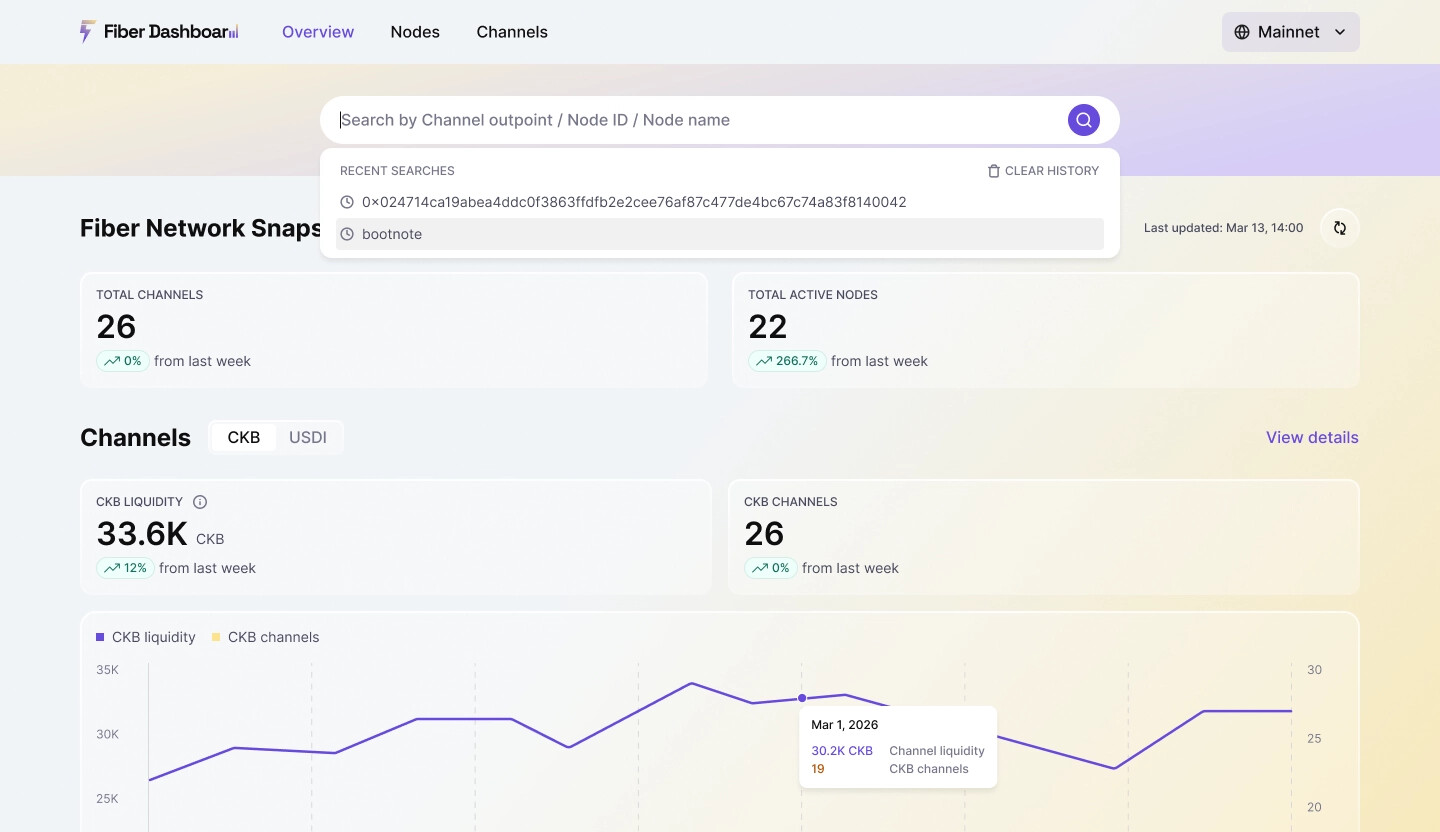
- 在顶部栏中可通过 channel outpoint、节点 ID 或节点名称进行搜索。搜索结果支持分页,并可按多个列进行排序。
- 右上角可随时切换 Mainnet / Testnet,全站数据实时刷新
6. 数据更新机制
- 首页关键指标每 30 秒 自动刷新
- 全量数据每 5 分钟 同步一次,兼顾实时性与系统稳定性
Fiber Network Dashboard 对所有人开放,无需注册或配置。
只需访问 https://dashboard.fiber.channel ,即可开始探索。
无论你是节点运营者、流动性提供者,还是关注 CKB 二层生态的开发者或社区成员,Dashboard 都能为你提供清晰、准确、实时的网络信息。
我们欢迎反馈和建议,以持续改进 Fiber 仪表盘。
Fiber Network Dashboard
A Real-Time Observability Tool for the CKB Layer 2 Network
Introduction
Fiber is a payment channel network built on CKB, enabling fast and low-cost off-chain value transfers. While the protocol is already live, understanding its actual state—such as how many nodes are active, where liquidity resides, and how channels open and close—has remained challenging. Relevant data is scattered across on-chain transactions and individual nodes, with no unified view available.
The Fiber Network Dashboard addresses this gap by aggregating on-chain and network-level data into a single public interface. It provides real-time visibility into the network’s structure, activity, and health—without requiring technical expertise or running a node.
Visit: https://dashboard.fiber.channel
Why It Matters
Unlike base-layer blockchains, Layer 2 networks like Fiber operate primarily off-chain. While this improves scalability, it introduces an observability challenge: most activities—such as channel state updates, HTLC routing, and balance changes—do not appear directly on the blockchain. As a result, the full network state cannot be reconstructed from on-chain data alone.
Without observability:
- Node operators struggle to monitor their connectivity and channel performance
- Liquidity providers lack insight into capital distribution and associated risks
- Developers and researchers have limited means to analyze trends or debug issues
- The broader community cannot verify whether the network is growing or stable
The Dashboard restores this visibility—turning implicit activity into explicit, actionable data.
Who It’s For
- Node Operators: Monitor your node’s status, supported assets, auto-accept thresholds, and all associated channels
- Liquidity Providers: Track total liquidity, channel distribution, and asset-specific flows (CKB/USDI)
- Developers & Researchers: Analyze network topology, channel lifecycle patterns, and closure behavior
- Community Members: Get an at-a-glance view of Fiber’s adoption, health, and real-time activity
Core Features
1. Network Overview (Home)
- Real-time counts of active nodes and open channels
- Week-over-week trend indicators (growth or decline)
- Toggle between CKB and USDI asset views—with all metrics updating accordingly
- A treemap view of node connectivity, where larger blocks represent nodes with more channels, making highly connected nodes easier to spot.
2. Node Details
- A global map visualizing the geographic distribution of Fiber nodes and the channel connections between them, helping users understand the network’s structure at a glance.
- Searchable and filterable node list by country, node ID, or name (with 500ms input debounce); results sortable by activity, channel count, etc.
- Per-node profile includes:
- Node name, ID (copyable), location, and last seen time
- Supported assets and Auto Accept minimums (the lowest inbound channel capacity your node will automatically accept)
- Full list of associated channels with pagination and sorting; click any entry to view channel details
3. Channel Insights
- Overview:
- Channel status distribution (Open / Closing / Cooperative Closed / Uncooperative Closed)—a key indicator of network health
- Liquidity distribution histograms for CKB or USDI (using log-scale buckets)
- Channel List:
- Filter by status (real-time counts shown next to each option)
- Sort by liquidity, creation time, or last update
- Copyable Outpoint for each channel to enable on-chain verification
4. Channel Lifecycle Viewer
For any channel, view its complete on-chain history in a chronological timeline:
- Channel Opened (Funding): This is the initial funding transaction that creates the channel on-chain by locking funds in a shared Script. It shows block height, transaction hash, and a one-click link to CKB Explorer for verification.
- Commitment Updates: These represent state transitions within the channel—such as balance changes or HTLCs being added. The dashboard parses and displays:
- Parses Lock Args: pubkey hash, security delay (epoch), protocol version, settlement hash, and flag
- Shows local/remote balances and pending HTLC details
- Lists all unlocks (type, preimage presence, signature) and pending HTLCs (amount, payment hash, expiry)
- Flags “Watchtower protection detected” if applicable
- Channel Closed (Settlement): This is the final transaction that settles the channel’s final state on-chain. Clearly labeled as cooperative (blue) or uncooperative (red).
5. Global Search & Network Switching
- Search by channel outpoint, node ID, or node name from the top bar. Results are paginated and sortable by multiple columns.
- Toggle between Mainnet and Testnet in the top-right corner—data refreshes instantly across all pages
6. Data Freshness
- Key metrics on dashboard pages refresh every 30 seconds
- Full dataset syncs every 5 minutes, balancing real-time responsiveness with system stability
The Fiber Network Dashboard is open to everyone—no login or setup required.
Just visit https://dashboard.fiber.channel to start exploring.
Whether you’re operating a node, providing liquidity, or simply following Layer 2 development on CKB, the Dashboard gives you clear, accurate, and real-time insights into the Fiber Network.
We welcome feedback and suggestions as we continue improving the Fiber Dashboard.